Understanding weather symbols is crucial for interpreting weather maps, which can help you plan your daily activities.
Weather symbols, or icons, are visual tools used by meteorologists to represent the various atmospheric conditions in a concise and standardized format. These symbols are universally recognized and enable quick communication of weather information across different regions and languages.
When looking at a weather chart, you’ll see an array of symbols that denote specific weather phenomena such as temperature, cloud cover, precipitation, and wind speed. By familiarizing yourself with these symbols, you become better equipped to read forecasts and understand meteorological reports.
It’s especially important for outdoor planning, travel, and even for personal safety in severe weather conditions.
Weather symbols translate complex info into simple icons for quick understanding. Sun means clear, cloud means partly cloudy, rain means rain, snowflake means snow. These symbols help you make decisions about your day, like needing an umbrella.
Understanding Weather Symbols
Weather symbols are essential tools for conveying complex atmospheric conditions in a simple visual format. These symbols enable you to quickly understand the weather forecast and what to expect from the sky above.
Meteorological Icons and Their Meanings
Meteorological icons serve as a universal language for representing different weather events. For example, a simple sun symbol represents sunny conditions, while a cloud with rain underneath indicates rainfall. Icons may vary slightly depending on the source, but they maintain consistency in portraying key weather elements like rain, snow, and sunshine.
Symbols for Atmospheric Conditions
Common symbols for atmospheric conditions illustrate the state of the sky — ranging from clear, partly cloudy to overcast. The amount of cloud cover is often depicted with varying shades or patterns within the cloud symbols. Visual cues like fog, mist, and visibility are also graphically represented to forewarn you of potential changes in traveling conditions.
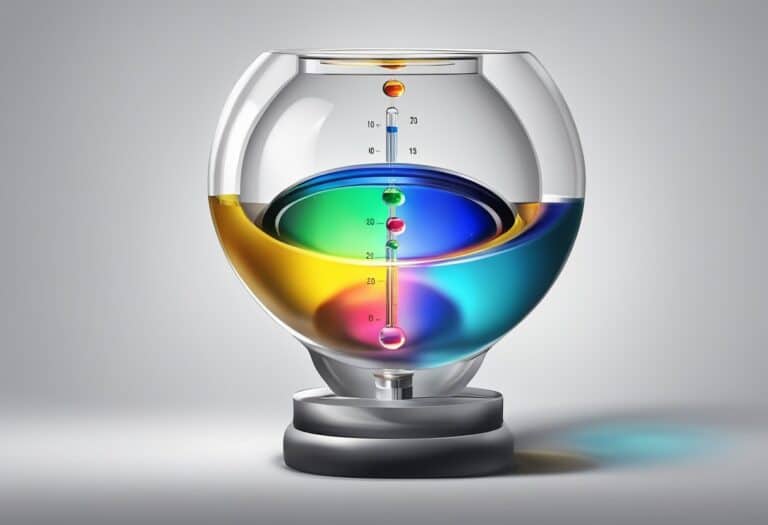
Temperature and Front Symbols
Temperature readings might be displayed in either Celsius or Fahrenheit, and sometimes both. Front symbols, indicating cold, warm, occluded, and stationary fronts, are crucial for predicting weather changes. A blue line with triangles signifies a cold front, while a red line with semi-circles represents a warm front, helping you predict potential temperature variations.
Wind and Pressure Indicators
Wind speed and direction are frequently noted with arrow symbols; the arrow’s length and the number of feathers can indicate wind speed in knots. Pressure is detailed through “H” for high and “L” for low pressure areas, alongside isobars – lines that depict areas of equal air pressure in millibars. A change in isobars’ proximity indicates a pressure tendency, which is instrumental in predicting upcoming wind conditions.
Precipitation and Storm Indicators
There is a variety of symbols to indicate different types of precipitation, such as light or heavy rain, sleet, and snow showers. Storm indicators, such as a lightning bolt for thunderstorms or a spiral for hurricanes and cyclones, alert you to severe weather events and potential hazards.
Specialized Weather Symbols
Specialized weather symbols can represent conditions like hail storms or specific cloud types that impact flight plans or signal shifts in the atmosphere. Their usage is more common in detailed meteorological reports or educational material, enabling experts and enthusiasts to gauge more accurate atmospheric readings.
Interpreting Weather Maps for Forecasting
Weather maps provide critical data for forecasting by presenting a range of atmospheric conditions. Understanding their symbols allows you to predict weather events with greater accuracy.
Understanding Air Masses and Front Movements
Air masses are large bodies of air with uniform temperature and humidity. Hot air masses are typically lighter and rise, while cold air masses are heavier and sink. Fronts are the boundaries between different air masses. A cold front, indicated by a line with triangles, showcases cooler weather moving in; conversely, a warm front, depicted by a line with semicircles, signals warmer air approaching.
Reading Isobar Patterns and Pressure Tendency
Isobars are lines that connect areas of equal atmospheric pressure. Closely spaced isobars indicate high wind speeds and possibly worsening weather conditions. A falling pressure tendency can suggest an approaching storm system, while rising pressure often indicates improving weather. These pressures are typically measured in millibars (mb).
Analyzing Cloud Formations
Clouds tell a lot about impending weather. Cirrus clouds, high and wispy, often precede a change in the weather, while cumulus clouds may indicate fair weather. However, if cumulus clouds grow vertically, it can be a sign of potential thunderstorms. The cloud type and cloud height play crucial roles in forecasting.
Assessing Wind Patterns and Speed
Wind direction and speed, often shown with wind barbs, signify weather changes. A wind barb displays the wind direction from which it is blowing and its speed in knots. A longer barb or flag indicates stronger winds. Wind patterns can influence the movement of air masses and the development of storm systems.
Predicting Precipitation and Storm Potential
Symbols for precipitation include variously shaped icons representing rain, snow, and other forms of precipitation. Concentrations of precipitation symbols can indicate potential for thunderstorms or severe weather. Tracking the movement of these symbols over time helps predict the path and intensity of storms.
Weather Forecasting Tools and Technology
As you delve into the complex world of meteorology, it’s essential to understand the tools and technology that allow meteorologists to accurately predict weather patterns. From ground-based sensors to advanced satellites, these instruments provide the data necessary to construct reliable forecasts.
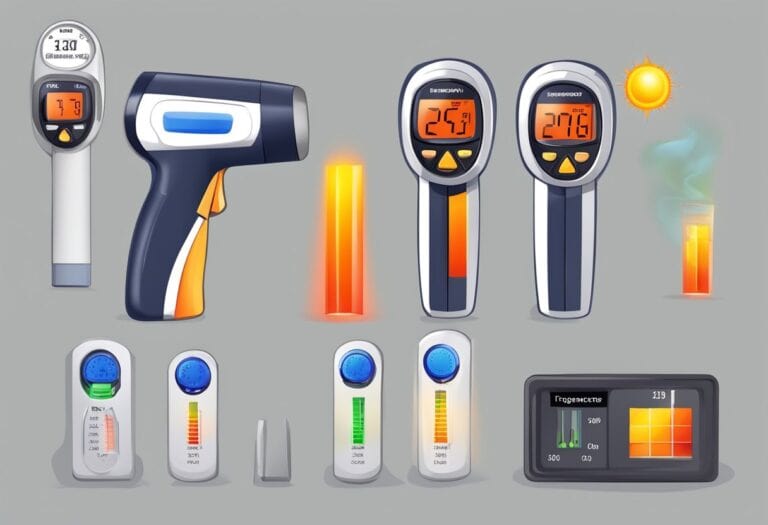
Meteorologist’s Toolbox
Your local meteorologist relies on a range of instruments to measure atmospheric conditions. Weather stations are fundamental components, typically equipped with a barometer for tracking atmospheric pressure—a critical factor in forecasting. Thermometers measure temperature, while anemometers record wind speed and direction. Hygrometers gauge humidity levels. Together, these tools furnish a comprehensive set of data your meteorologist uses to analyze and forecast local weather patterns.
Technology in Weather Prediction
With advancements in technology, weather prediction has evolved significantly. Weather models are sophisticated computer programs that process vast amounts of data from various sources to simulate and predict weather conditions. Meteorologists use these models in conjunction with ground observations and weather maps, including synoptic weather maps, to foresee weather up to several days in advance. Apps for devices, like your iPhone, leverage these models and share real-time information and alerts from organizations like the National Weather Service.
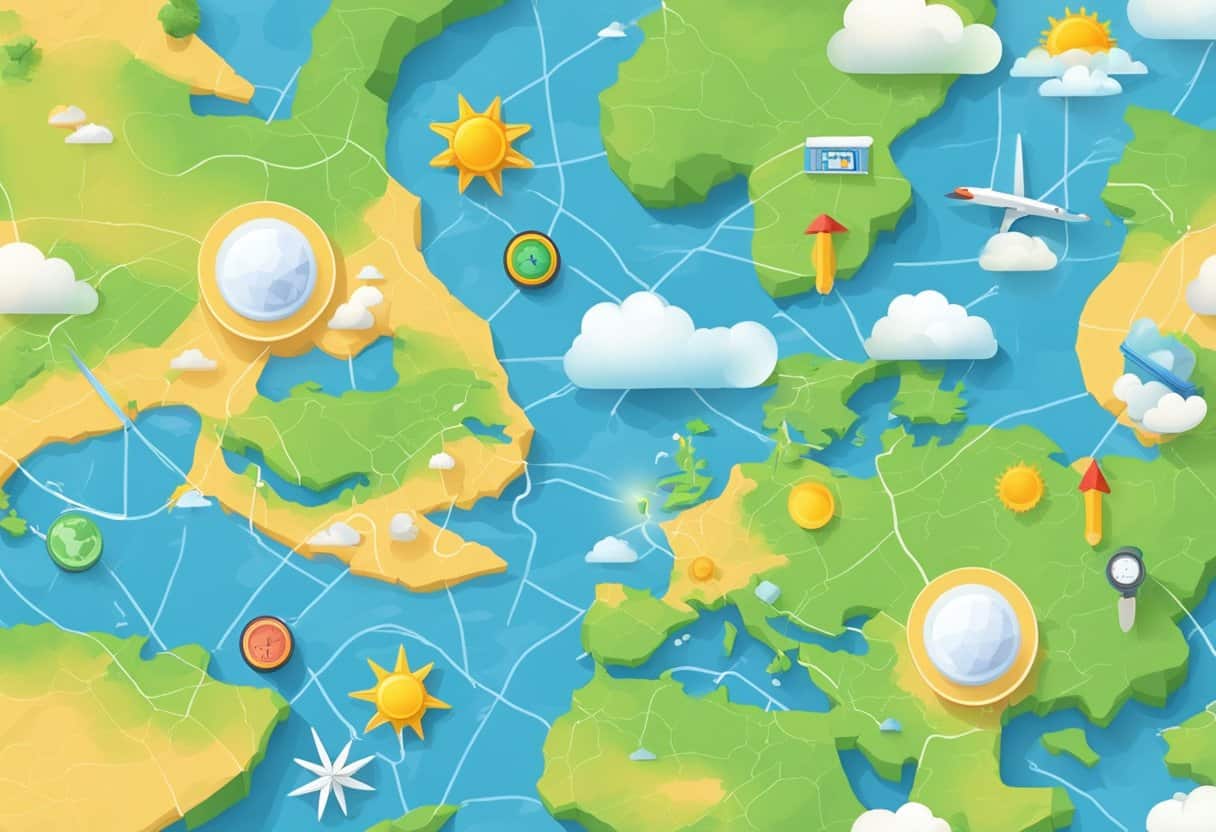
Global Weather Monitoring Systems
At a larger scale, global weather monitoring systems are pivotal in observing and predicting severe weather events affecting regions like Europe, the United States, and Canada. Weather satellites offer a “bird’s eye view”, collecting data across vast areas, including remote oceans where traditional weather stations are sparse. This satellite information is fed into global models, which help track storm systems and inform internationally distributed weather reports.
By integrating data from local instruments and global technology, meteorologists provide you with accurate weather reports and forecasts that help plan your daily activities and prepare for severe weather events.
The Role of Weather Symbols in Daily Life
Weather symbols are a crucial component of meteorological forecasts. They quickly convey a range of information about present weather conditions with efficiency and clarity. Whether you’re planning a weekend getaway or deciding if you need an umbrella for a short stroll, understanding these symbols can significantly impact your day-to-day decisions.
When you glance at a weather forecast, you’re likely looking at icons representing sun, clouds, rain, or snow, among others. The simplicity of this setup allows you to process the daily climate outlook swiftly. For instance, a sun icon typically indicates clear skies, while a cloud with two lines might represent steady rain. These symbols are standards across forecasts, reducing confusion regardless of the city or region you’re in.
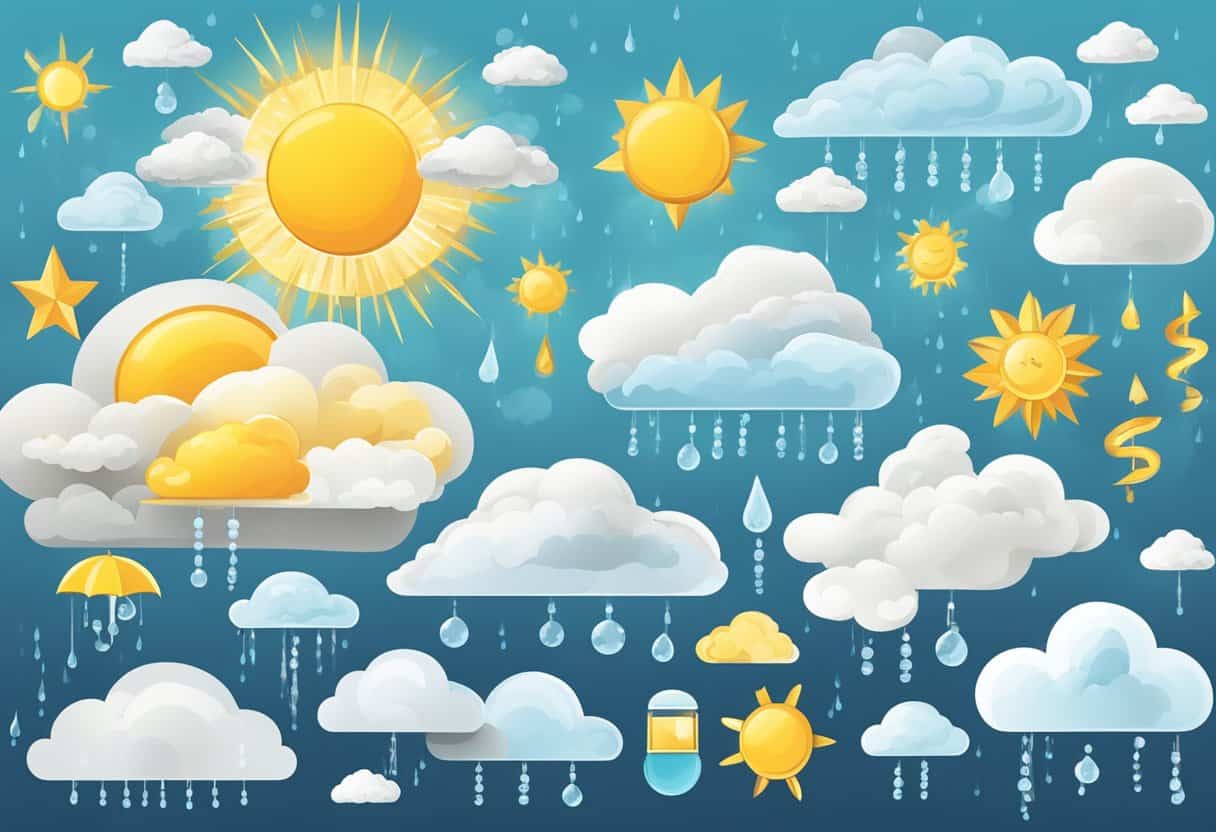
Here’s a brief guide to some common weather symbols:
- Sun – Clear skies, usually associated with fair weather.
- Cloud – Partly cloudy conditions, which might indicate increased humidity or upcoming changes in weather.
- Raindrop – Rain is likely; the number of raindrops can indicate the expected rainfall intensity.
- Snowflake – Snowfall is anticipated; similarly, the number of flakes can suggest accumulation levels.
Weather symbols also encompass a broader range of data. For example, arrows indicate wind direction, with the length suggesting its speed. Other symbols can reflect specific conditions such as fog, thunderstorms, or even hurricanes, alerting you to the severity and necessary precautions.
By incorporating symbols that hint at factors like altitude, gravity, gases, or the time of sunrise, weather forecasts give you a comprehensive overview without overburdening you with scientific details. This empowers you to focus on how the day’s weather will affect your plans, be it for agriculture, travel, or your daily commute, while also providing an immediate understanding of environmental changes in your locality.
Frequently Asked Questions
This section helps you understand the various symbols you encounter in weather forecasts. These symbols are standardized visual representations of meteorological phenomena.
How can one interpret the symbols displayed on the Weather app for iPhone?
When using the Weather app on your iPhone, symbols like a sun indicate clear skies, while a cloud represents overcast conditions. A raindrop signifies likely precipitation, and a snowflake stands for snow.
What does each symbol on a weather forecast represent?
Weather forecast symbols commonly convey information about precipitation, cloud cover, and severe weather conditions. For example, symbols with sun and clouds denote partly cloudy weather, whereas lighting bolts indicate thunderstorms.
Could you explain the meaning behind the cloud symbol accompanied by snowflakes on weather applications?
The symbol of a cloud with snowflakes typically denotes snowfall. It is used on weather applications to predict that snow is expected in the area.
Is there a chart or guide that illustrates the various weather symbols and their meanings?
Yes, there are guides available, such as the one found in the World Meteorological Organization’s Manual of Codes, which provide a comprehensive list of weather symbols and their meanings.
What are the meanings of symbols commonly found on The Weather Channel’s forecast displays?
The Weather Channel uses a range of symbols, from suns for sunny days to crescent moons for clear nights. Additionally, you might see symbols like a cloud with a lightning bolt, which indicates a thunderstorm.
Can you list the most common weather symbols used in meteorology and what they signify?
Common weather symbols include a filled sun (clear skies), a half sun behind a cloud (partly cloudy), raindrops (rain), snowflakes (snow), and a triangle with lines (wind). Each symbol succinctly informs you of anticipated weather conditions.